
International SEO & Website Localization Statistics 2026
127 statistics on international SEO and website localization, each linked to its original source and checked on 26 October 2026.
By DigitalUs Media teamUpdated 29 min read
127 statistics on international SEO and website localization: who is online, which languages the web and its search engines use, how hreflang is implemented, how language shapes buying decisions across borders, and how AI is changing search and translation. Every figure links to the page that published it and was checked against that page on 26 October 2026.
Key takeaways
- About 6 billion people were online in 2025, but internet use ranged from 94% in high-income countries to 23% in low-income countries (ITU).
- English is the content language of 49.5% of websites (W3Techs, October 2026), while English speakers make up an estimated 15.48% of internet users (OBDILCI, 2025).
- Google is not the default everywhere: in September 2026 Yandex held 70.33% of search in Russia, Baidu 46.65% in China and Naver 43.06% in South Korea (Statcounter).
- Hreflang is still a minority practice: about one in five pages carried hreflang in the 2025 Web Almanac crawl, and 67% of domains using it had at least one error in Ahrefs’ 2023 study of 374,756 domains.
- In DHL’s 2026 survey of 29,000 shoppers in 29 countries, 70% buy from retailers abroad, but only 45% do so at least once a month.
- 76% of online shoppers prefer product information in their own language and 40% never buy from sites in other languages (CSA Research, 2020, 8,709 consumers in 29 countries).
- AI is changing both search and translation: 58.5% of US and 59.7% of EU Google searches ended without a click in 2024, and only 17% of businesses in DeepL’s 2026 research had deployed LLM or agentic AI for translation.
Who is online
In short: The 2.2 billion people still offline live almost entirely in low- and middle-income countries, where internet use lags far behind the 94% of high-income countries.
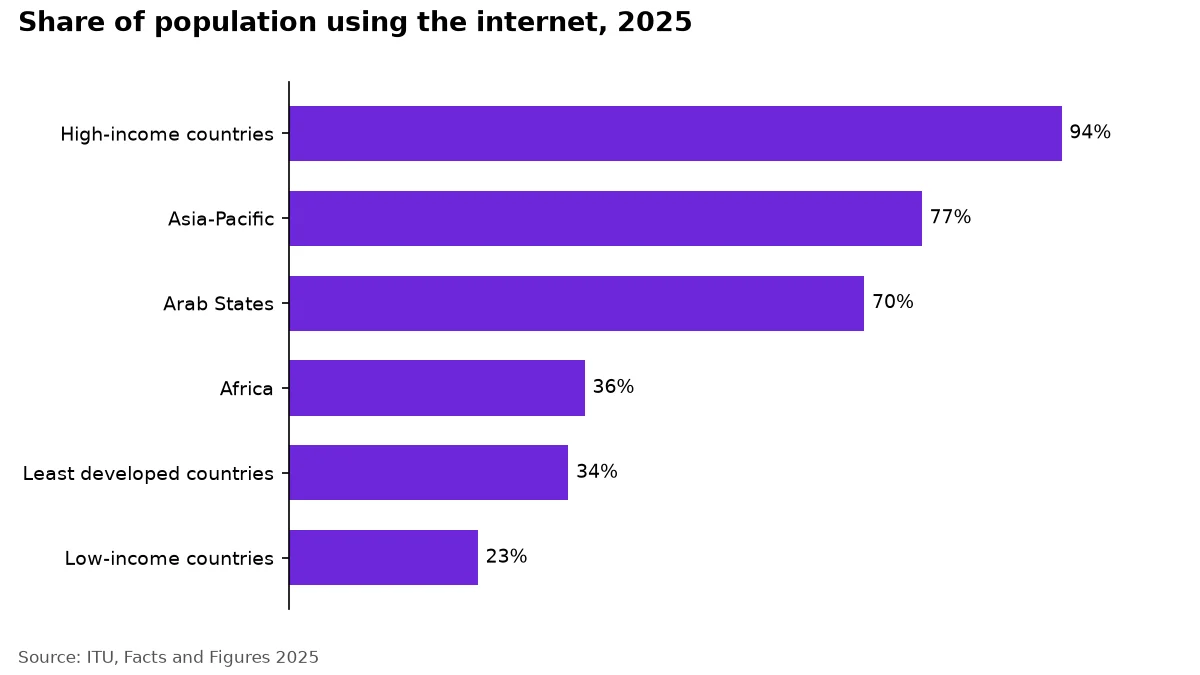
Internet use by income group and region, 2025. Source: ITU Facts and Figures 2025.
- An estimated 6 billion people worldwide, about three-quarters of the global population, were using the internet in 2025. (Source: ITU – Facts and Figures 2025 press release)
- In 2025, 2.2 billion people worldwide were still offline, down from a revised 2.3 billion in 2024. (Source: ITU – Facts and Figures 2025 press release)
- In 2025, 94 per cent of people in high-income countries used the internet, compared with only 23 per cent of people in low-income countries. (Source: ITU – Facts and Figures 2025 press release)
- In 2025, 96 per cent of the world’s offline population lived in low- and middle-income countries. (Source: ITU – Facts and Figures 2025 press release)
- In 2025, 5G networks reached 84 per cent of people in high-income countries but only 4 per cent of people in low-income countries. (Source: ITU – Facts and Figures 2025 press release)
- Only 36 per cent of the population of Africa used the internet in 2025, the lowest rate of any ITU region. (Source: ITU – Facts and Figures 2025: Internet use)
- Internet use in the Asia-Pacific region stood at 77 per cent of the population in 2025, in line with the global average. (Source: ITU – Facts and Figures 2025: Internet use)
- Internet use in the Arab States region stood at 70 per cent of the population in 2025. (Source: ITU – Facts and Figures 2025: Internet use)
- Only 34 per cent of people in the least developed countries and 38 per cent in landlocked developing countries were online in 2025. (Source: ITU – Facts and Figures 2025: Internet use)
- Internet use in the least developed countries grew by an average of 7.4 per cent in 2025, faster than in most other country groups or regions. (Source: ITU – Facts and Figures 2025: Internet use)
- In 2024, 4.7 billion people, 58% of the world’s population, used mobile internet on their own device. (Source: GSMA – State of Mobile Internet Connectivity 2025 press release)
- In 2024, 3.1 billion people lived within reach of mobile internet coverage but did not use it. (Source: GSMA – State of Mobile Internet Connectivity 2025 press release)
- In 2024, 93% of people not connected to mobile internet lived in low- and middle-income countries. (Source: GSMA – State of Mobile Internet Connectivity 2025 press release)
Languages of the web
In short: Website content is far more English than the people using the internet, which leaves most non-English speakers underserved.
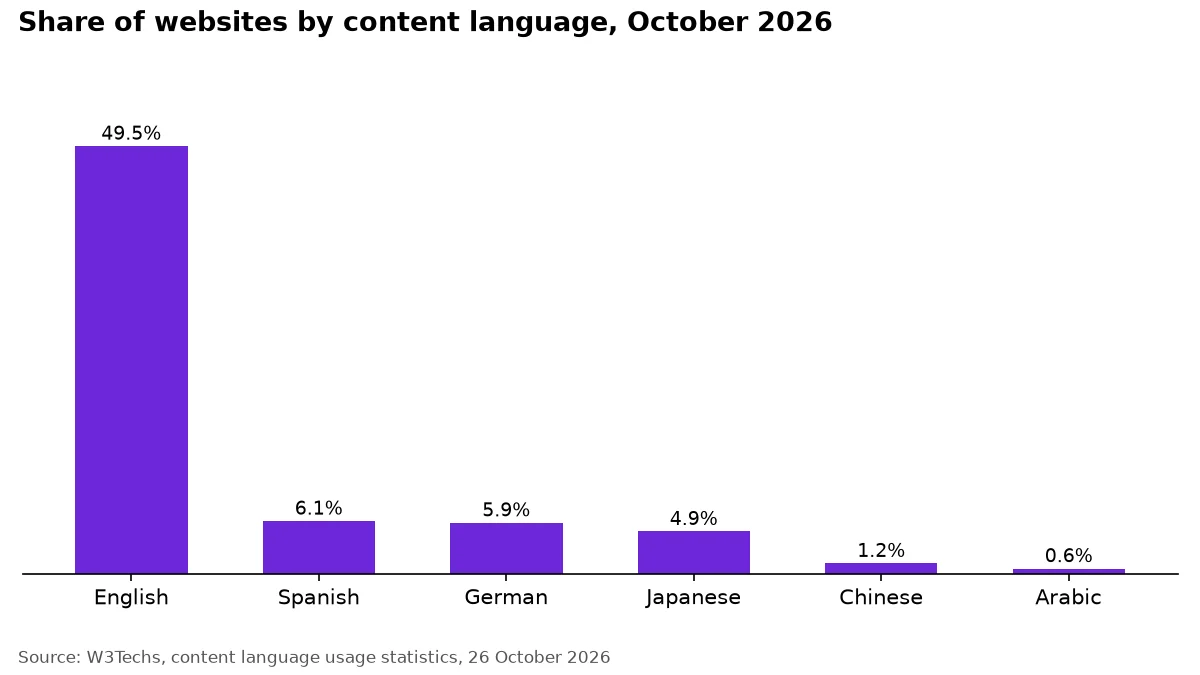
English dominates website content while Chinese and Arabic barely register. Source: W3Techs, October 2026.
- As of October 2026, English was the content language of 49.5% of websites whose language W3Techs could identify. (Source: W3Techs – Usage statistics of content languages for websites)
- As of October 2026, Spanish was the second most common website content language, used by 6.1% of websites with a known language. (Source: W3Techs – Usage statistics of content languages for websites)
- As of October 2026, German was the content language of 5.9% of websites with a known language. (Source: W3Techs – Usage statistics of content languages for websites)
- As of October 2026, Japanese was the content language of 4.9% of websites with a known language. (Source: W3Techs – Usage statistics of content languages for websites)
- As of October 2026, Chinese was the content language of just 1.2% of websites with a known language. (Source: W3Techs – Usage statistics of content languages for websites)
- As of October 2026, Arabic was the content language of only 0.6% of websites with a known language. (Source: W3Techs – Usage statistics of content languages for websites)
- As of October 2026, Hindi was used as a content language by less than 0.1% of websites, according to W3Techs. (Source: W3Techs – Usage statistics of content languages for websites)
- In Common Crawl’s CC-MAIN-2026-43 web crawl (2026), English was the primary language of 42.5647% of crawled HTML pages. (Source: Common Crawl – Crawl statistics: distribution of languages)
- In Common Crawl’s CC-MAIN-2026-43 web crawl (2026), Chinese was the primary language of 4.3706% of crawled HTML pages. (Source: Common Crawl – Crawl statistics: distribution of languages)
- In Common Crawl’s CC-MAIN-2026-43 web crawl (2026), Hindi was the primary language of only 0.2111% of crawled HTML pages. (Source: Common Crawl – Crawl statistics: distribution of languages)
- The Observatory of Linguistic and Cultural Diversity on the Internet (OBDILCI) estimated in July 2025 that English speakers made up 15.48% of the world’s internet users. (Source: OBDILCI (Funredes) – Languages on the Internet, results V6)
- OBDILCI estimated in July 2025 that Chinese speakers made up 17.57% of the world’s internet users, a larger share than English speakers. (Source: OBDILCI (Funredes) – Languages on the Internet, results V6)
- OBDILCI’s 2025 model, which estimates all web content rather than top websites, put English at roughly 20% of web content and Chinese at 19%. (Source: OBDILCI (Funredes) – Languages on the Internet, results V6)
Search engines by country
In short: In Russia, China, South Korea, Japan and the Czech Republic a Google-only SEO plan misses a large part of search demand.
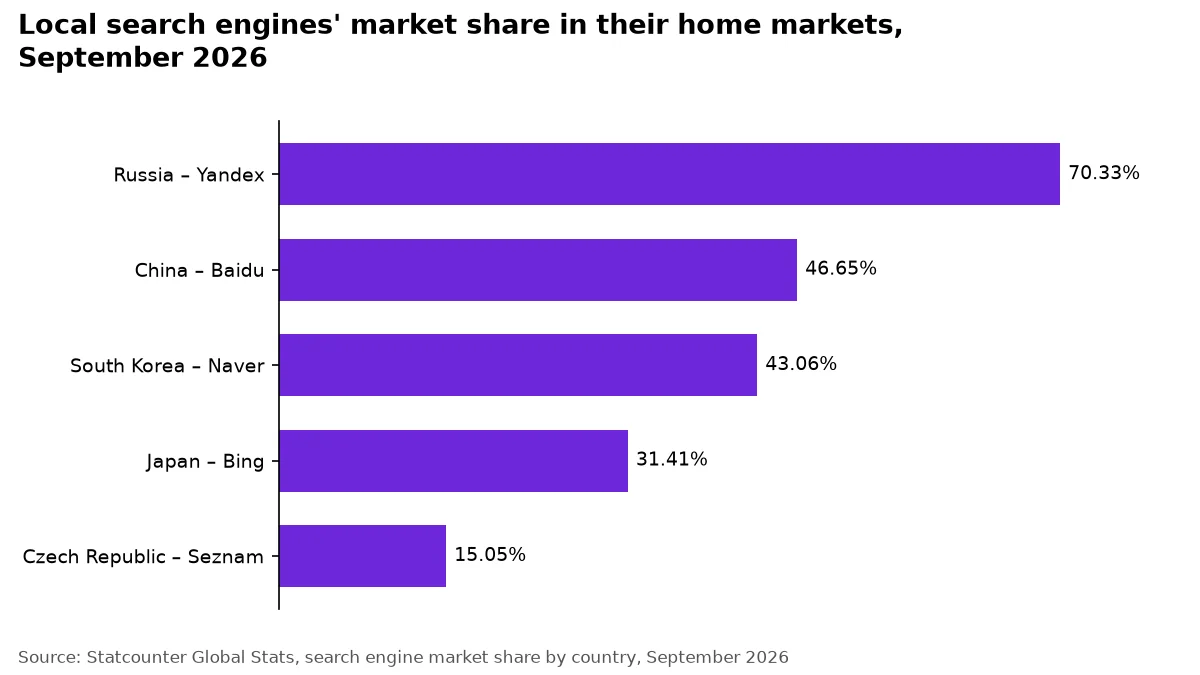
Outside Google’s worldwide 89.94% share, local or alternative engines take a large slice of search in several major markets.
- Google held 89.94% of search engine market share worldwide in September 2026, according to Statcounter. (Source: Statcounter Global Stats – Search Engine Market Share Worldwide)
- In South Korea, Google had a 47.97% search engine market share in September 2026, per Statcounter. (Source: Statcounter Global Stats – Search Engine Market Share in Republic of Korea)
- Naver took 43.06% of search engine market share in South Korea in September 2026, close behind Google, per Statcounter. (Source: Statcounter Global Stats – Search Engine Market Share in Republic of Korea)
- Baidu led search in China with a 46.65% market share in September 2026, according to Statcounter. (Source: Statcounter Global Stats – Search Engine Market Share in China)
- Google had only a 1.46% search engine market share in China in September 2026, per Statcounter. (Source: Statcounter Global Stats – Search Engine Market Share in China)
- Yandex held 70.33% of search engine market share in Russia in September 2026, according to Statcounter. (Source: Statcounter Global Stats – Search Engine Market Share in Russian Federation)
- Google’s search engine market share in Russia was 28.12% in September 2026, per Statcounter. (Source: Statcounter Global Stats – Search Engine Market Share in Russian Federation)
- Google had a 59.27% search engine market share in Japan in September 2026, according to Statcounter. (Source: Statcounter Global Stats – Search Engine Market Share in Japan)
- Bing reached a 31.41% search engine market share in Japan in September 2026, per Statcounter. (Source: Statcounter Global Stats – Search Engine Market Share in Japan)
- Czech search engine Seznam held a 15.05% market share in the Czech Republic in September 2026, according to Statcounter. (Source: Statcounter Global Stats – Search Engine Market Share in Czech Republic)
- Yandex reported that its share of the Russian search market reached 67.5% in the second quarter of 2025, based on its Yandex Radar analytics service. (Source: Yandex – Q2 2025 financial results press release)
- The Baidu App had 679 million monthly active users in December 2025, flat year over year, according to Baidu’s Q4 and fiscal year 2025 results. (Source: Baidu – Fourth Quarter and Fiscal Year 2025 Results (press release via PR Newswire Asia))
- Naver’s AI Briefing answers appeared on more than 20 percent of total searches in South Korea by December 2025, meeting its year-end target. (Source: The Korea Times – Naver’s AI-powered search surpasses 20% milestone (reporting Naver’s announcement))
Hreflang adoption and errors
In short: Few sites use hreflang, and most of those that do have errors, so a correct implementation is still a competitive advantage.
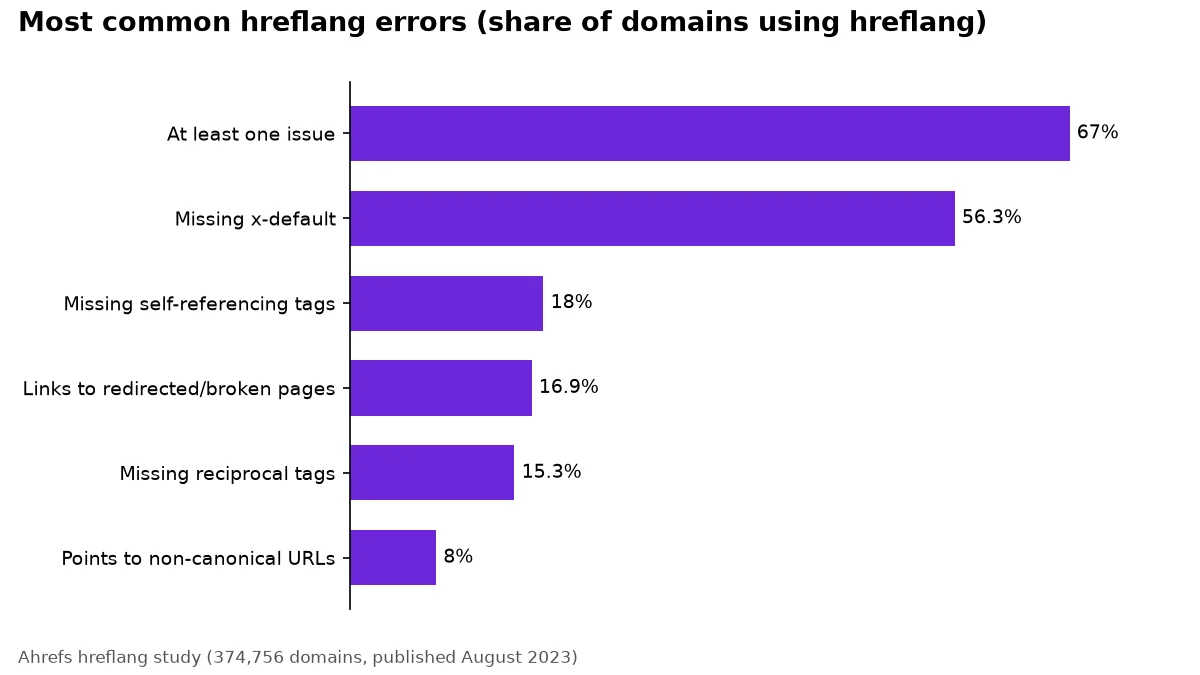
Two in three domains that use hreflang have at least one implementation error, most often a missing x-default.
- In the HTTP Archive’s 2025 crawl, hreflang appeared in the raw HTML of 20.3% of desktop pages and 19.7% of mobile pages, roughly double the 2024 rate. (Source: HTTP Archive – Web Almanac 2025, SEO chapter)
- Hreflang sent through HTTP headers is almost extinct: in 2025 it was found on just 0.2% of desktop pages and 0.1% of mobile pages. (Source: HTTP Archive – Web Almanac 2025, SEO chapter)
- In 2025, the x-default hreflang value appeared on 7.2% of desktop home pages and 6.9% of mobile home pages, second only to English. (Source: HTTP Archive – Web Almanac 2025, SEO chapter)
- In 2024, 10% of desktop websites and 9% of mobile websites used hreflang, according to the HTTP Archive Web Almanac. (Source: HTTP Archive – Web Almanac 2024, SEO chapter)
- In 2024, English (‘en’) was the most common content-language value, found on 18% of both home pages and inner pages in the HTTP Archive crawl. (Source: HTTP Archive – Web Almanac 2024, SEO chapter)
- In 2024, 13% of web pages had no lang attribute on the html element at all. (Source: HTTP Archive – Web Almanac 2024, Markup chapter)
- In 2025, roughly 86% of websites declared a valid lang attribute, about the same as in 2024. (Source: HTTP Archive – Web Almanac 2025, Accessibility chapter)
- Ahrefs found that 67% of the 374,756 domains using hreflang it studied in 2023 had at least one hreflang issue. (Source: Ahrefs – Hreflang study)
- The most frequent hreflang problem in Ahrefs’ 2023 study was a missing x-default, affecting 56.3% of domains using hreflang. (Source: Ahrefs – Hreflang study)
- In Ahrefs’ 2023 study, 18% of domains using hreflang had pages missing self-referencing hreflang tags. (Source: Ahrefs – Hreflang study)
- In Ahrefs’ 2023 study, 16.9% of domains using hreflang had tags pointing to redirected or broken pages. (Source: Ahrefs – Hreflang study)
- In Ahrefs’ 2023 study, 15.3% of domains using hreflang had pages missing reciprocal (return) tags. (Source: Ahrefs – Hreflang study)
- In Ahrefs’ 2023 study, 8% of domains using hreflang had tags pointing to non-canonical URLs. (Source: Ahrefs – Hreflang study)
Language and buying decisions
In short: Buyers strongly prefer their own language, and a large minority will not buy from sites in another language at all.
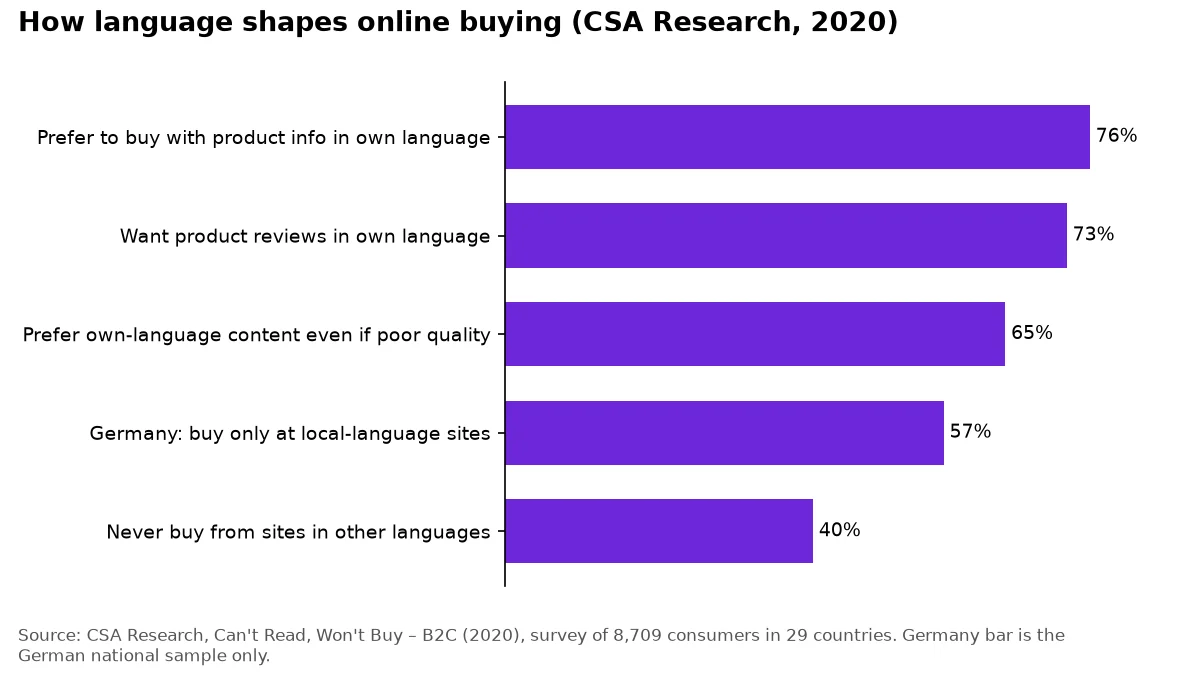
Three in four online shoppers in CSA Research’s 2020 survey preferred to buy with product information in their own language, and 40% said they never buy from sites in other languages.
- 76% of online shoppers prefer to buy products with information in their native language, according to CSA Research’s 2020 survey of 8,709 consumers in 29 countries. (Source: CSA Research – Consumers Prefer their Own Language (press release, Can’t Read, Won’t Buy – B2C))
- 40% of online shoppers will never buy from websites in other languages, according to CSA Research’s 2020 survey of 8,709 consumers in 29 countries. (Source: CSA Research – Consumers Prefer their Own Language (press release, Can’t Read, Won’t Buy – B2C))
- In Germany, 57% of consumers buy only at local-language websites, the highest share of any country in CSA Research’s 2020 survey of 8,709 consumers in 29 countries. (Source: CSA Research – Consumers Prefer their Own Language (press release, Can’t Read, Won’t Buy – B2C))
- 65% of consumers prefer content in their own language even if it is of poor quality, according to CSA Research’s 2020 survey of 8,709 consumers in 29 countries. (Source: CSA Research – Consumers Prefer their Own Language (press release, Can’t Read, Won’t Buy – B2C))
- 73% of consumers want product reviews in their own language, even if nothing else on the site is translated, according to CSA Research’s 2020 survey of 8,709 consumers in 29 countries. (Source: CSA Research – Consumers Prefer their Own Language (press release, Can’t Read, Won’t Buy – B2C))
- Given two similar products, 89% of consumers with no English-language competence pick the one with information in their language, according to CSA Research’s 2020 survey of 8,709 consumers in 29 countries. (Source: CSA Research – Consumers Prefer their Own Language (press release, Can’t Read, Won’t Buy – B2C))
- 75% of consumers say they are more likely to buy from the same brand again if customer care is offered in their language, according to CSA Research’s 2020 survey of 8,709 consumers in 29 countries. (Source: CSA Research – Does Language Matter? The Impact of Language on the Customer Journey (blog))
- 66% of B2B business users said they would pay up to 30% more for a localized product, in CSA Research’s survey of 1,116 B2B respondents published in March 2022. (Source: CSA Research – Do B2B Buyers Value Localized Experiences? (blog))
- Only 34% of consumers said they would pay more for localized products, in CSA Research’s survey of 9,909 consumers published in March 2022. (Source: CSA Research – Do B2B Buyers Value Localized Experiences? (blog))
- 56% of multilingual U.S. consumers have decided not to buy from a company because its website or app felt poorly adapted to their language, in Liferay’s September 2026 survey of 800 U.S. adults. (Source: Liferay – 2026 Website Localization Report (press release))
- 48% of multilingual U.S. consumers have picked one company over a competitor because its website or app better fit their language and culture, in Liferay’s September 2026 survey of 800 U.S. adults. (Source: Liferay – 2026 Website Localization Report (press release))
- Only 23% of multilingual U.S. consumers say non-English websites usually feel written for them, in Liferay’s September 2026 survey of 800 U.S. adults. (Source: Liferay – 2026 Website Localization Report (press release))
Language skills in Europe
In short: Even in Europe, a large share of adults cannot comfortably use another language, so English-only sites limit their reach.
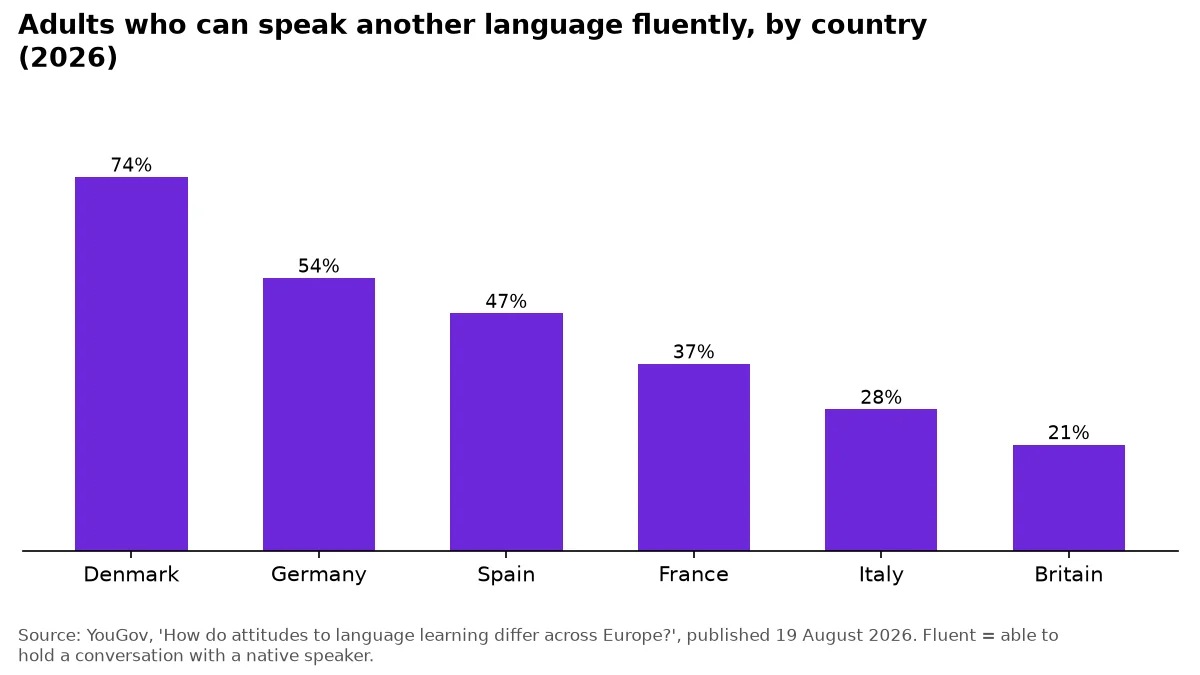
Outside Denmark and Germany, most adults in YouGov’s 2026 survey said they could not hold a conversation in any language other than their own.
- 47% of Europeans can speak English as a foreign language, according to the Special Eurobarometer ‘Europeans and their languages’ survey of 26,523 people in the 27 EU countries in September-October 2023. (Source: European Commission – Press release IP/24/2686: New Eurobarometer shows Europeans’ positive attitude towards language learning)
- 59% of Europeans can have a conversation in at least one foreign language, according to the Special Eurobarometer survey of 26,523 EU residents in September-October 2023. (Source: European Commission – Press release IP/24/2686: New Eurobarometer shows Europeans’ positive attitude towards language learning)
- Only 28% of Europeans can have a conversation in more than one foreign language, according to the Special Eurobarometer survey of 26,523 EU residents in September-October 2023. (Source: European Commission – Press release IP/24/2686: New Eurobarometer shows Europeans’ positive attitude towards language learning)
- 7 out of 10 young Europeans aged 15 to 24 can have a conversation in English, according to the Special Eurobarometer survey of 26,523 EU residents in September-October 2023. (Source: European Commission – Press release IP/24/2686: New Eurobarometer shows Europeans’ positive attitude towards language learning)
- 74% of adults in Denmark say they can speak a language other than their native one fluently enough to converse with a native speaker, in a YouGov survey published in August 2026. (Source: YouGov – How do attitudes to language learning differ across Europe?)
- 54% of adults in Germany say they can speak another language fluently enough to converse with a native speaker, in a YouGov survey published in August 2026. (Source: YouGov – How do attitudes to language learning differ across Europe?)
- 47% of adults in Spain say they can speak another language fluently enough to converse with a native speaker, in a YouGov survey published in August 2026. (Source: YouGov – How do attitudes to language learning differ across Europe?)
- Only 37% of adults in France say they can speak another language fluently enough to converse with a native speaker, in a YouGov survey published in August 2026. (Source: YouGov – How do attitudes to language learning differ across Europe?)
- Only 28% of adults in Italy say they can speak another language fluently enough to converse with a native speaker, in a YouGov survey published in August 2026. (Source: YouGov – How do attitudes to language learning differ across Europe?)
- Only 21% of adults in Britain say they can speak another language fluently enough to converse with a native speaker, in a YouGov survey published in August 2026. (Source: YouGov – How do attitudes to language learning differ across Europe?)
- France scored 539 on the EF English Proficiency Index 2025, ranking #38 of 123 countries and regions (global average 488). (Source: EF Education First – EF English Proficiency Index 2025, France fact sheet)
- Italy scored 513 on the EF English Proficiency Index 2025, ranking #59 of 123 countries and regions, versus 624 for top-ranked Netherlands. (Source: EF Education First – EF English Proficiency Index 2025, Italy)
Cross-border e-commerce
In short: Buying from abroad is common, but price, delivery and trust decide it, and many English-speaking sellers still do not localize.
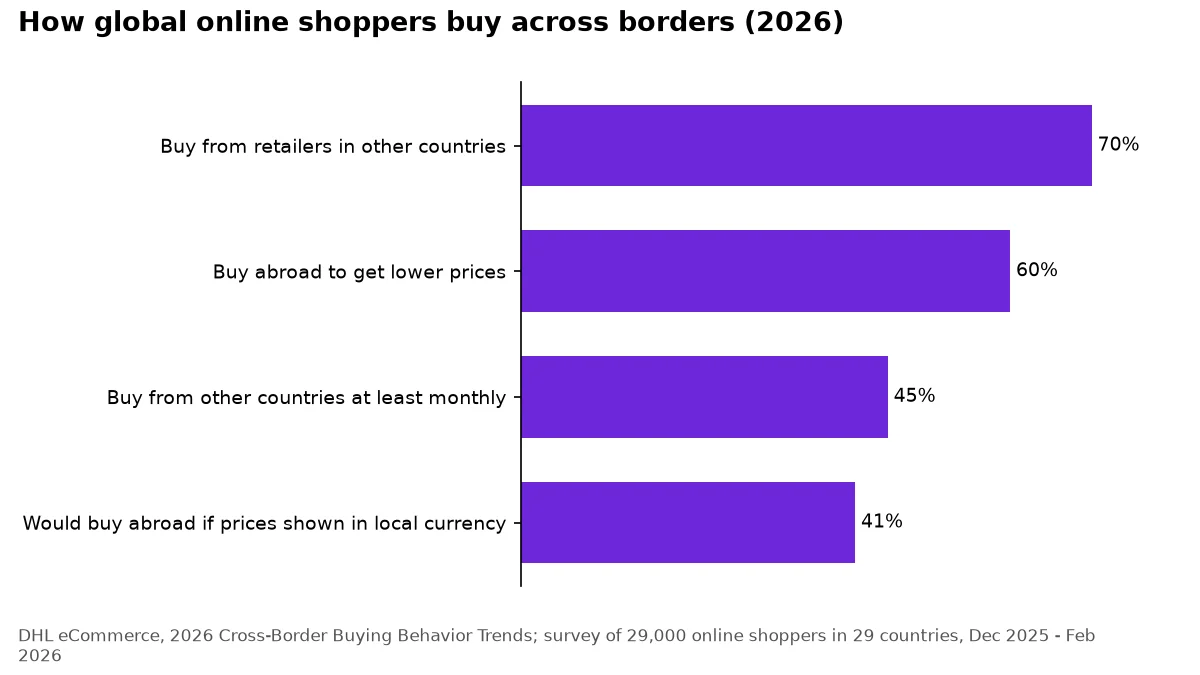
Most online shoppers have bought from abroad, but fewer than half do it every month.
- In DHL’s 2026 E-Commerce Trends survey of 29,000 online shoppers in 29 countries (fieldwork December 2025 to February 2026), 70% said they buy from retailers outside their home country. (Source: DHL eCommerce – 2026 Cross-Border Buying Behavior Trends)
- Only 45% of global online shoppers buy from retailers in other countries at least once a month, according to DHL’s 2026 survey of 29,000 shoppers in 29 countries. (Source: DHL eCommerce – 2026 Cross-Border Buying Behavior Trends)
- Lower prices are the top reason for buying across borders: 60% of shoppers worldwide in DHL’s 2026 survey of 29,000 shoppers buy from other countries to get lower prices. (Source: DHL eCommerce – 2026 Cross-Border Buying Behavior Trends)
- Prices shown in local currency would encourage 41% of global shoppers to buy from abroad, per DHL’s 2026 survey of 29,000 shoppers in 29 countries. (Source: DHL eCommerce – 2026 Cross-Border Buying Behavior Trends)
- In DHL’s 2026 survey of 5,800 online businesses in 28 countries, 63% said they adapt their online stores with local languages and currencies for each market they serve. (Source: DHL eCommerce – 2026 Cross-Border Buying Behavior Trends)
- 21% of US B2C online businesses do not localize their e-commerce with local languages and currencies, according to DHL’s 2026 business survey (22% in Canada, 18% in the UK). (Source: DHL eCommerce – 2026 Cross-Border Buying Behavior Trends)
- 78% of EU internet users aged 16-74 bought or ordered goods or services online in 2025, up from 62% in 2015. (Source: Eurostat – E-commerce statistics for individuals (Statistics Explained))
- Temu’s share of the most recent cross-border online orders rose from less than 1% in 2022 to 24% in 2025, making it the most used cross-border e-retailer alongside Amazon (IPC survey of 30,970 cross-border shoppers in 37 countries). (Source: International Post Corporation – Cross-Border E-commerce Shopper Survey 2025)
- For 61% of cross-border online shoppers, clear information on delivery charges before purchase is essential when buying from another country (IPC survey of 30,970 shoppers in 37 countries, September 2025). (Source: International Post Corporation – Cross-Border E-commerce Shopper Survey 2025)
- Only 7% of cross-border parcels took 15 or more days to arrive in 2025, down from 29% in 2020, according to IPC’s survey of 30,970 cross-border shoppers in 37 countries. (Source: International Post Corporation – Cross-Border E-commerce Shopper Survey 2025)
- Global exports of digitally delivered services reached US$ 4.64 trillion in 2024, up 8.3% on the previous year, according to the WTO. (Source: World Trade Organization – Global Trade Outlook and Statistics, April 2025)
- Global exports of digitally delivered services reached US$ 5.26 trillion in 2025, up 10%, according to the WTO’s March 2026 trade outlook. (Source: World Trade Organization – Global Trade Outlook and Statistics, March 2026)
Zero-click and AI search
In short: More searches end without a click in both the US and the EU, and AI answers are spreading unevenly across countries and languages.
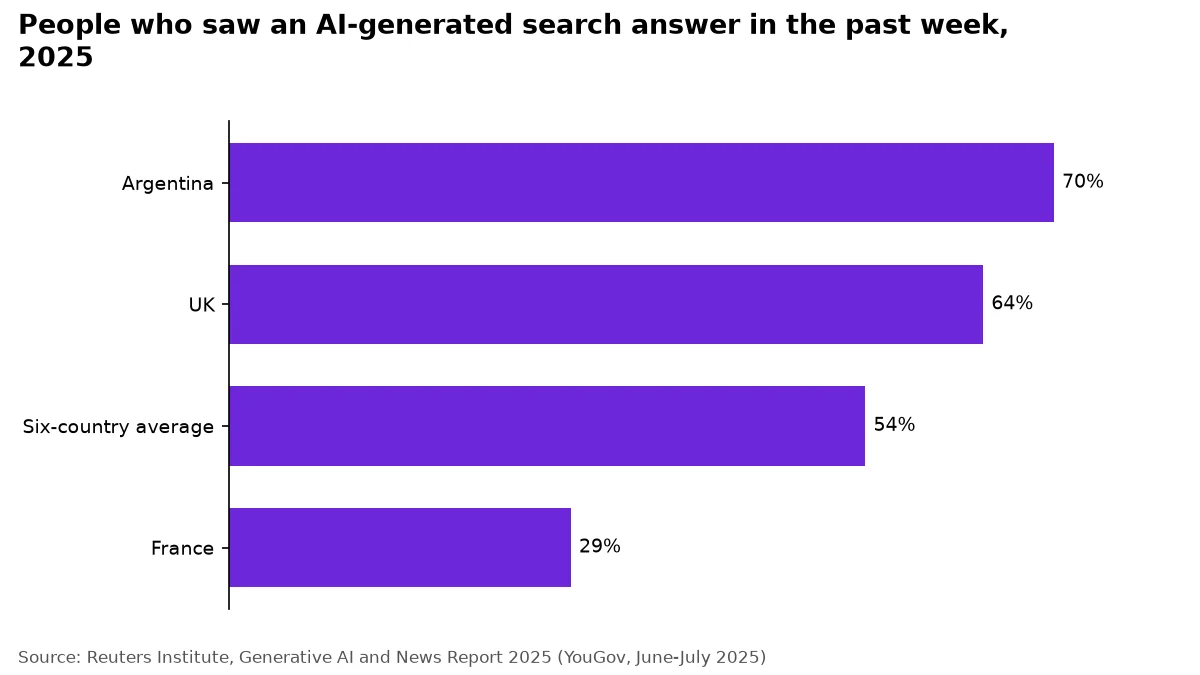
Exposure to AI answers in search varies sharply by market, largely tracking where Google has rolled out AI Overviews.
- 58.5% of Google searches in the United States ended without a click in 2024, according to SparkToro’s analysis of Datos clickstream data. (Source: SparkToro – 2024 Zero-Click Search Study)
- 59.7% of Google searches in the European Union ended without a click in 2024, per SparkToro and Datos. (Source: SparkToro – 2024 Zero-Click Search Study)
- For every 1,000 Google searches in the United States in 2024, only 360 clicks went to websites not owned by Google. (Source: SparkToro – 2024 Zero-Click Search Study)
- For every 1,000 Google searches in the European Union in 2024, 374 clicks went to the open web. (Source: SparkToro – 2024 Zero-Click Search Study)
- In a Pew Research Center panel of 900 U.S. adults (March 2025), Google users who saw an AI summary clicked a traditional search result in 8% of visits, versus 15% of visits with no AI summary. (Source: Pew Research Center – Google users are less likely to click on links when an AI summary appears in the results)
- In Seer Interactive’s client data for informational queries, organic click-through rate on searches with a Google AI Overview was 0.61% in September 2025; Seer reports this as a 61% overall decline from its June 2024 baseline. (Source: Seer Interactive – AIO Impact on Google CTR: September 2025 Update)
- In Ahrefs’ study of Search Console data for 300,000 keywords, the presence of an AI Overview correlated with a 58% lower click-through rate for the position-one page in December 2025, compared with a forecast of CTR without AI Overviews. (Source: Ahrefs – Update: AI Overviews Reduce Clicks by 58%)
- Google said AI Overviews had over 2 billion monthly users across more than 200 countries and territories and 40 languages in Q2 2025. (Source: Google – Q2 2025 earnings call: remarks from our CEO (blog.google))
- 18% of respondents in India said they used AI chatbots to access news weekly in early 2025, compared with just 3% in the UK. (Source: Reuters Institute – Digital News Report 2025, Executive Summary)
- On average across six countries, 54% of people said they had seen an AI-generated answer to a search in the past week in mid-2025. (Source: Reuters Institute – Generative AI and News Report 2025)
- 70% of people in Argentina said they had seen an AI-generated search answer in the past week in mid-2025, the highest of six countries surveyed. (Source: Reuters Institute – Generative AI and News Report 2025)
- 64% of people in the UK said they had seen an AI-generated search answer in the past week in mid-2025. (Source: Reuters Institute – Generative AI and News Report 2025)
- Only 29% of people in France said they had seen an AI-generated search answer in the past week in mid-2025, when Google’s AI Overviews had not yet launched there. (Source: Reuters Institute – Generative AI and News Report 2025)
The localization industry
In short: The language services market is still growing, but much more slowly than forecast before generative AI.
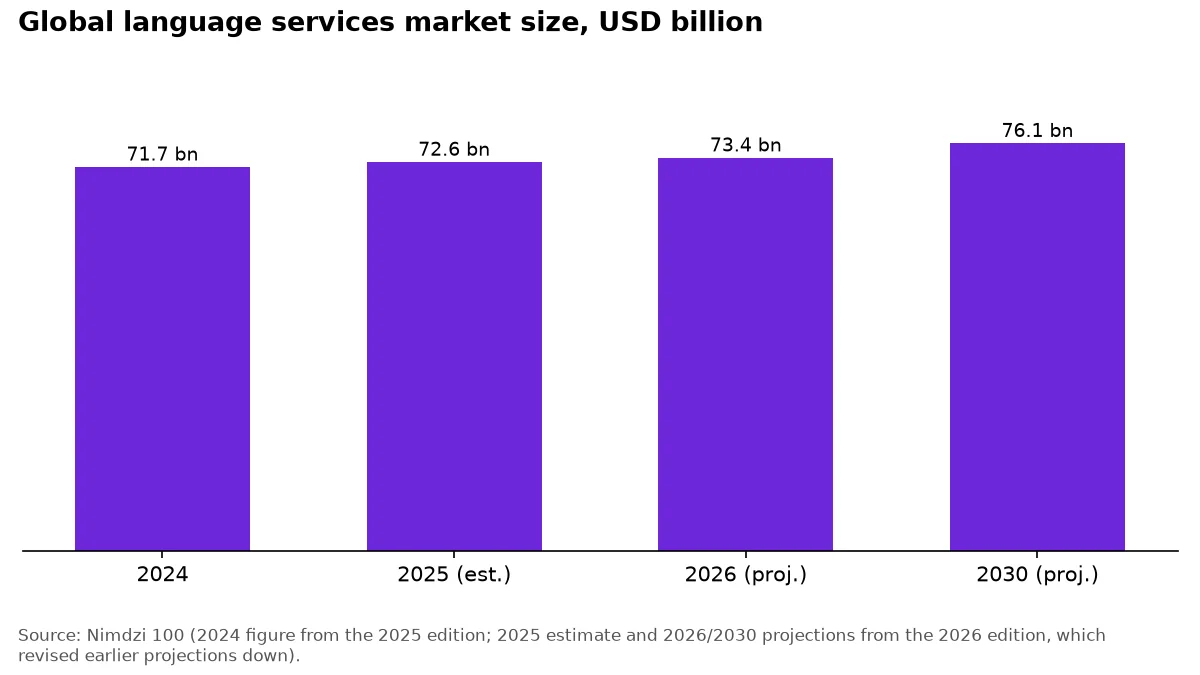
Global language services market size in USD billion: 2024 from the Nimdzi 100 2025; the 2025 estimate and 2026 and 2030 projections from the Nimdzi 100 2026.
- Nimdzi estimates the global language services industry reached USD 71.7 billion in 2024. (Source: Nimdzi Insights – The 2025 Nimdzi 100)
- The global language industry reached an estimated USD 72.6 billion in 2025, according to the 2026 Nimdzi 100. (Source: Nimdzi Insights – The 2026 Nimdzi 100)
- Nimdzi projected in 2026 that the global language industry will grow only slightly, to USD 73.4 billion in 2026. (Source: Nimdzi Insights – The 2026 Nimdzi 100)
- Nimdzi’s realistic forecast, published in its 2026 report, projects the global language industry to reach USD 76.1 billion by 2030. (Source: Nimdzi Insights – The 2026 Nimdzi 100)
- The 10 largest language service providers held 9.9% of the global language industry market in 2025, per the 2026 Nimdzi 100. (Source: Nimdzi Insights – The 2026 Nimdzi 100)
- AI-generated translation is offered by 70.3% of language providers responding to Nimdzi’s 2026 survey, second only to editing of AI-generated content (72.0%). (Source: Nimdzi Insights – The 2026 Nimdzi 100)
- TransPerfect reported billed revenues of $1.32 billion for 2025, an increase of 7%. (Source: TransPerfect – press release: Billed Revenues Increase 7% in 2025 to $1.32 Billion)
- RWS reported revenue of £690.1m for the year ended 30 September 2025, a 4% decline from £718.2m in FY2024. (Source: RWS Holdings plc – Final results for the year ended 30 September 2025 (RNS))
- 28% of RWS group revenue in the year to 30 September 2025 came from AI-related products and services, up from 25% in FY2024. (Source: RWS Holdings plc – Final results for the year ended 30 September 2025 (RNS))
- Interpreters and translators held about 73,900 jobs in the United States in 2025. (Source: US Bureau of Labor Statistics – Occupational Outlook Handbook: Interpreters and Translators)
- The median annual wage for US interpreters and translators was $60,170 in May 2025. (Source: US Bureau of Labor Statistics – Occupational Outlook Handbook: Interpreters and Translators)
- The US Bureau of Labor Statistics projects employment of interpreters and translators to grow just 2 percent from 2025 to 2035, slower than the average for all occupations. (Source: US Bureau of Labor Statistics – Occupational Outlook Handbook: Interpreters and Translators)
- In the European Language Industry Survey 2025 (1,322 participants from 50 countries), 88% of responding language companies had revenue below €5M. (Source: ELIA – article on the ELIS 2025 European Language Industry Survey results)
AI and machine translation
In short: Businesses are adopting AI for language work, but most translation workflows are still manual or traditional.
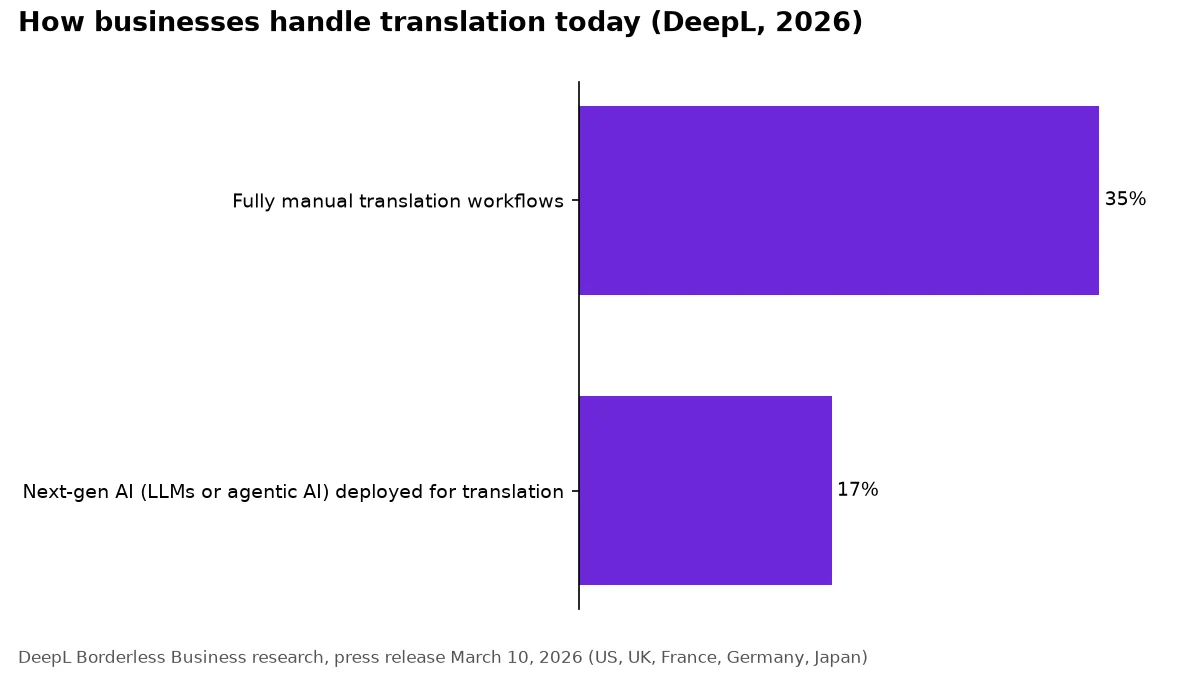
Twice as many businesses still translate fully by hand as have deployed LLM or agentic AI translation.
- In 2025, 19.95% of enterprises in the EU used at least one AI technology. (Source: Eurostat – Use of artificial intelligence in enterprises (Statistics Explained))
- In 2025, 8.76% of EU enterprises used AI that generates written or spoken language (or programming code). (Source: Eurostat – Use of artificial intelligence in enterprises (Statistics Explained))
- Among EU enterprises using AI in 2025, 34.70% used it for marketing or sales. (Source: Eurostat – Use of artificial intelligence in enterprises (Statistics Explained))
- In Ireland, 9.3% of all enterprises used AI for natural language generation in 2025, the second most common AI use after data mining. (Source: Central Statistics Office (Ireland) – Information Society Statistics, Enterprises 2025: Artificial Intelligence)
- In 2025, 18% of businesses in France used at least one AI technology, eight points more than in 2024. (Source: INSEE – ICT usage in enterprises 2025 (AI use))
- In DeepL’s 2026 ‘Borderless Business’ research among business leaders in the US, UK, France, Germany and Japan, 35% of businesses still relied on fully manual translation workflows. (Source: DeepL – Borderless Business research (press release, March 10, 2026))
- Only 17% of businesses in DeepL’s 2026 survey had deployed next-generation AI tools (LLMs or agentic AI) for translation. (Source: DeepL – Borderless Business research (press release, March 10, 2026))
- In DeepL’s survey of 5,000 executives in the US, UK, France, Germany and Japan (September 2025), 64% of businesses planned to increase investment in language AI in 2026. (Source: DeepL – 2026 executive outlook research (press release, December 3, 2025))
- In DeepL’s survey of 780 senior decision makers in EMEA and the US (October 2024), 25% of businesses planned to use AI for specific tasks such as translation in 2025. (Source: DeepL – ‘The language revolution’ research (press release, February 12, 2025))
- In Crowdin’s survey of 152 B2B professionals in the US and Canada (January-February 2026), roughly 95% already used AI or machine translation. (Source: Crowdin – AI Translation Enterprise Survey 2026)
- In Crowdin’s 2026 survey, 65.8% of respondents said AI translation happens inside a translation management system (TMS). (Source: Crowdin – AI Translation Enterprise Survey 2026)
- In 2024, Google added 110 new languages to Google Translate, representing more than 614 million speakers. (Source: Google – The Keyword blog: 110 new languages are coming to Google Translate)
- 75% of knowledge workers worldwide used AI at work in 2024, according to Microsoft’s survey of 31,000 people in 31 markets. (Source: Microsoft – 2024 Work Trend Index Annual Report)
Methodology
We collected statistics only from the organisations that produced the data: international bodies (ITU, WTO, Eurostat, the European Commission), statistics offices (INSEE, CSO Ireland, the US Bureau of Labor Statistics), measurement services (W3Techs, Statcounter, Common Crawl, the HTTP Archive), research institutes (Pew Research Center, Reuters Institute, OBDILCI) and companies publishing their own survey or study data (CSA Research, DHL, IPC, Nimdzi, DeepL, Crowdin, Liferay, Ahrefs, Seer Interactive, SparkToro/Datos, YouGov, EF). We avoided statistics roundups. One figure (Naver AI Briefing) comes from a news report because Naver’s own release only states the target; it is marked as secondary. Every source page was opened and the figure was matched to the exact text printed on it: 101 stats automatically by a script that fetches each URL and searches for the number, and 26 by reading the page or PDF manually (W3Techs and DHL block automated requests; several sources are PDFs). Each claim was then reviewed against the surrounding text for population, measure, country and year. The year on each stat is the year the data describes, not the publication year. Caveats: vendor-funded surveys (DeepL, Crowdin, Liferay, DHL, Ahrefs, Seer) reflect each vendor’s own sample, which we name in the stat. Measures differ between sources: W3Techs counts the top websites, Common Crawl counts crawled pages and OBDILCI models all web content, so their English shares differ. Yandex’s own Q2 2025 market-share measurement (67.5%) differs from Statcounter’s September 2026 figure (70.33%) because of different methods and periods. The HTTP Archive 2025 SEO chapter’s text and figure label its hreflang percentages differently; we report the text. Seer Interactive states a 61% decline, although its own CTR figures imply a larger drop; we report the figure as published. Nimdzi’s 2026 edition revised its earlier market projections down; we use the 2026 edition for 2025 onward. The most cited language-preference study (CSA Research, 2020) is older than the rest of the page and is dated accordingly. Measurement pages such as W3Techs and Statcounter update continuously, so their figures are a snapshot for the stated month. We review this page every quarter; next refresh: 26 January 2027.
Sources
- Ahrefs – Hreflang study
- Ahrefs – Update: AI Overviews Reduce Clicks by 58%
- Baidu – Fourth Quarter and Fiscal Year 2025 Results (press release via PR Newswire Asia)
- Central Statistics Office (Ireland) – Information Society Statistics, Enterprises 2025: Artificial Intelligence
- Common Crawl – Crawl statistics: distribution of languages
- Crowdin – AI Translation Enterprise Survey 2026
- CSA Research – Consumers Prefer their Own Language (press release, Can’t Read, Won’t Buy – B2C)
- CSA Research – Do B2B Buyers Value Localized Experiences? (blog)
- CSA Research – Does Language Matter? The Impact of Language on the Customer Journey (blog)
- DeepL – ‘The language revolution’ research (press release, February 12, 2025)
- DeepL – 2026 executive outlook research (press release, December 3, 2025)
- DeepL – Borderless Business research (press release, March 10, 2026)
- DHL eCommerce – 2026 Cross-Border Buying Behavior Trends
- EF Education First – EF English Proficiency Index 2025, France fact sheet
- EF Education First – EF English Proficiency Index 2025, Italy
- ELIA – article on the ELIS 2025 European Language Industry Survey results
- European Commission – Press release IP/24/2686: New Eurobarometer shows Europeans’ positive attitude towards language learning
- Eurostat – E-commerce statistics for individuals (Statistics Explained)
- Eurostat – Use of artificial intelligence in enterprises (Statistics Explained)
- Google – Q2 2025 earnings call: remarks from our CEO (blog.google)
- Google – The Keyword blog: 110 new languages are coming to Google Translate
- GSMA – State of Mobile Internet Connectivity 2025 press release
- HTTP Archive – Web Almanac 2024, Markup chapter
- HTTP Archive – Web Almanac 2024, SEO chapter
- HTTP Archive – Web Almanac 2025, Accessibility chapter
- HTTP Archive – Web Almanac 2025, SEO chapter
- INSEE – ICT usage in enterprises 2025 (AI use)
- International Post Corporation – Cross-Border E-commerce Shopper Survey 2025
- ITU – Facts and Figures 2025 press release
- ITU – Facts and Figures 2025: Internet use
- Liferay – 2026 Website Localization Report (press release)
- Microsoft – 2024 Work Trend Index Annual Report
- Nimdzi Insights – The 2025 Nimdzi 100
- Nimdzi Insights – The 2026 Nimdzi 100
- OBDILCI (Funredes) – Languages on the Internet, results V6
- Pew Research Center – Google users are less likely to click on links when an AI summary appears in the results
- Reuters Institute – Digital News Report 2025, Executive Summary
- Reuters Institute – Generative AI and News Report 2025
- RWS Holdings plc – Final results for the year ended 30 September 2025 (RNS)
- Seer Interactive – AIO Impact on Google CTR: September 2025 Update
- SparkToro – 2024 Zero-Click Search Study
- Statcounter Global Stats – Search Engine Market Share in China
- Statcounter Global Stats – Search Engine Market Share in Czech Republic
- Statcounter Global Stats – Search Engine Market Share in Japan
- Statcounter Global Stats – Search Engine Market Share in Republic of Korea
- Statcounter Global Stats – Search Engine Market Share in Russian Federation
- Statcounter Global Stats – Search Engine Market Share Worldwide
- The Korea Times – Naver’s AI-powered search surpasses 20% milestone (reporting Naver’s announcement)
- TransPerfect – press release: Billed Revenues Increase 7% in 2025 to $1.32 Billion
- US Bureau of Labor Statistics – Occupational Outlook Handbook: Interpreters and Translators
- W3Techs – Usage statistics of content languages for websites
- World Trade Organization – Global Trade Outlook and Statistics, April 2025
- World Trade Organization – Global Trade Outlook and Statistics, March 2026
- Yandex – Q2 2025 financial results press release
- YouGov – How do attitudes to language learning differ across Europe?
How to cite these statistics
Each statistic links to the organisation that published it: please cite that original source. If this page helped you find it, a link to https://digitalusmedia.com/international-seo-statistics/ (or to a single stat, such as #s037) is appreciated. Last verified: 26 October 2026. Next scheduled review: 2027-01-26 (YYYY-MM-DD).