
SEO KPIs: The 12 Metrics That Show Whether SEO Is Working
The SEO KPIs that matter are clicks, conversions and indexed pages, not one average position. Here are 12 metrics, where to find them and how to read them.
By DigitalUs Media teamPublished 7 min read
The SEO KPIs that show whether SEO is working are organic conversions and non-branded organic clicks. Everything else, from impressions to indexed pages to referring domains, is a supporting metric that explains why those two go up or down.
Below are the 12 metrics we track, where to find each one in Google Search Console and Google Analytics 4, and how to read them. As an honest example, we use our own site’s numbers from a year where SEO wasn’t working.
SEO KPIs vs SEO metrics
A metric is anything you can measure. A KPI is one of the few metrics tied to a business goal and reported every month.
For most businesses, the goal of SEO is leads or sales from people who didn’t already know the brand. So the KPIs sit at the end of the chain (conversions, non-branded clicks), and the metrics earlier in the chain tell you what to fix.
Leading and lagging indicators
SEO is slow, so it helps to split the list in two:
- Leading indicators move first: indexed pages, impressions, number of queries, position distribution, Core Web Vitals. They show whether Google can find, index and start showing your pages.
- Lagging indicators move last: clicks, organic sessions, key events, revenue. They show whether the work is paying off.
In the first months of a new site or a rebuild, we’d expect only the leading indicators to move. Judging a three-month-old project on revenue alone usually leads to stopping work that was on track.
The 12 SEO KPIs
1. Organic clicks
Where: Search Console, Performance report, “Total clicks”.
The number of times someone clicked through from Google Search to your site. It’s Google’s own count, which makes it more reliable than analytics sessions for measuring search alone.
2. Non-branded clicks
Where: Search Console, Performance report, with a query filter that excludes your brand name.
Clicks from people searching for your brand would mostly find you anyway. Clicks from searches like “technical seo audit checklist” are the ones SEO actually earns. Report the two separately.
3. Impressions
Where: Search Console, Performance report, “Total impressions”.
How often your pages were shown in results, whether or not anyone scrolled to them. Impressions rise before clicks do, so they’re the first sign that new content is being picked up.
4. Click-through rate (CTR)
Where: Search Console, Performance report, “Average CTR”.
Clicks divided by impressions. Read it per query or per page, not site-wide: a page with a high position and a low CTR usually needs a better title or description.
5. Position distribution
Where: Search Console, Performance report, Queries tab, exported and grouped by position (1–3, 4–10, 11–20, 21–50, 50+).
This replaces “average position” as a KPI (see below why). Moving queries from page 2 into the top 10 is what eventually produces clicks.
6. Average position, read with care
Where: Search Console, Performance report.
Useful for a single query or a single page over time. Misleading as a site-wide number, for reasons covered in the next section.
7. Indexed pages
Where: Search Console, Page indexing report.
The number of your pages Google has indexed, compared with the number you want indexed. A gap usually points to technical problems (blocked pages, duplicates, weak content) that no amount of link building will fix. Our technical SEO audit checklist covers how to work through it.
8. Number of ranking queries
Where: Search Console, Performance report, Queries tab (the export is capped at 1,000 rows; the API gives more).
How many different searches you appear for. Growth here, even at low positions, shows Google sees the site as relevant to more topics.
9. Organic sessions and engaged sessions
Where: GA4, Reports, Acquisition, Traffic acquisition, filtered to “Organic Search”.
What visitors do after the click. Engaged sessions (longer than 10 seconds, with a key event, or with two or more page views) tell you more than raw sessions.
10. Organic key events (conversions)
Where: GA4, with the actions that matter marked as key events, filtered to organic traffic.
The KPI closest to the business: form submissions, calls, purchases, sign-ups. On our site, clicks on “Request a free consultation” buttons and on the email address send a cta_click event to GA4, and that event is what we count as a conversion (a “key event” in GA4 terms). Without something like this, you can only guess whether SEO traffic produces anything.
11. Genuine referring domains
Where: the Links report in Search Console, or a backlink tool.
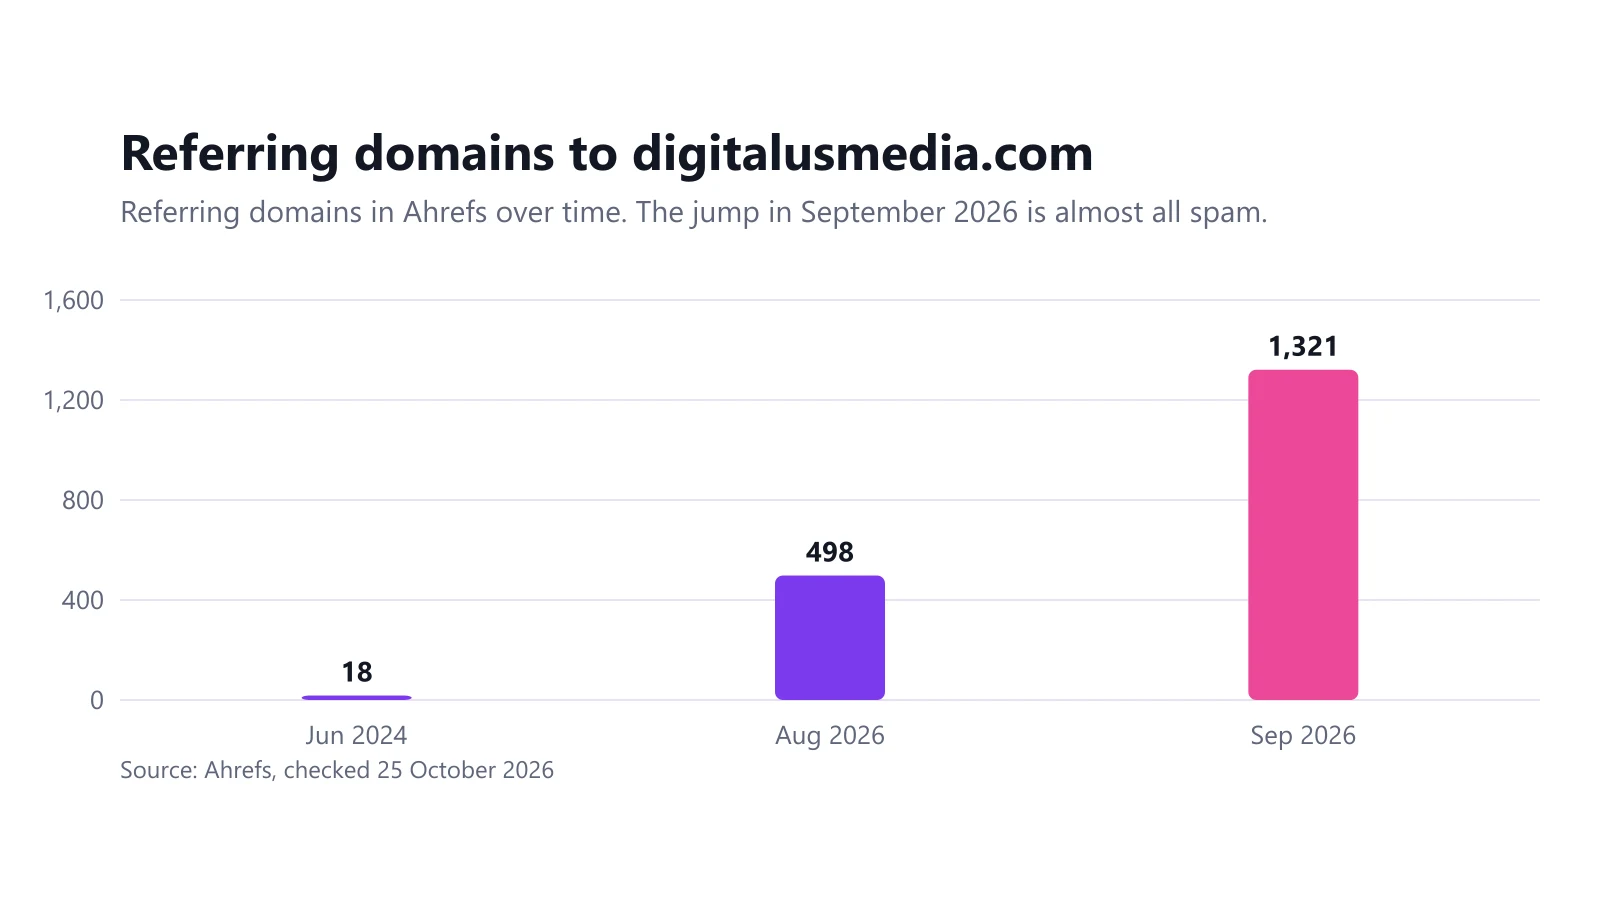
Count the sites that link to you because they chose to, not the total. Total referring domains is easy to inflate and easy to pollute: ours went from 498 to 1,321 in a month, almost all spam, while the number of genuine referring domains stayed at 3. The full story is in our negative SEO attack case study.
12. Core Web Vitals pass rate
Where: Search Console, Core Web Vitals report.
The share of URLs with “Good” LCP, INP and CLS for real visitors. Google describes Core Web Vitals as part of page experience; in our view it’s a hygiene metric, worth fixing when it fails, not one to chase once it passes.
Why average position misleads
Search Console’s average position is averaged over every impression of every query. That has odd effects:
- New long-tail rankings drag it down. If you start appearing at position 60 for 50 new queries, the site-wide average gets worse, even though nothing lost ground.
- One query can dominate. A query with thousands of impressions at position 80 can outweigh a dozen queries in the top 10.
- It ignores clicks. Position 5 for a query nobody searches is worth less than position 9 for one that brings visitors.
Our site shows this clearly. From December 2025 to October 2026, its monthly average position moved between about 56 and 79. When impressions collapsed in September 2026, the average barely changed (71 in August, 74 in September), because the few impressions left came from the same low-ranking queries. The average said “stable” while visibility fell by 98%.
Our rule of thumb: report position distribution site-wide, and average position only for individual queries you care about.
What these KPIs looked like on our own site
Here is digitalusmedia.com from 10 December 2025 to 25 October 2026, before we rebuilt it:
| KPI | Value | What it told us |
|---|---|---|
| Organic clicks | 1 in 11 months | SEO wasn’t producing visitors |
| Impressions | 11,896 | Google was showing the site, but low down |
| Ranking queries | 281 | Some topical relevance |
| Queries in the top 10 | 0 (4 in 11–20, 22 in 21–50, 254 below 50) | Almost everything on page 3 or lower |
| Brand query “digitalus” | Average position 14.8 | The site didn’t rank first for its own name |
| Monthly impressions, Aug → Sep 2026 | 1,393 → 24 | Something changed sharply in September |
| Genuine referring domains | 3 out of 1,219 | Almost no real authority |
Two things stand out. Impressions were the only metric that looked like progress, and they hid the fact that no query was close to page one. And the brand position was the cheapest problem to fix and the most telling: if a site doesn’t rank for its own name, it has a basic trust or technical issue before it has a content issue.
These numbers are our baseline. We’ll measure the rebuilt site against them.
How to set targets for SEO KPIs
- Start from a baseline. Export at least 3 months (ideally 16, the most Search Console keeps) before changing anything.
- Set targets on leading indicators first. “All 25 important pages indexed” and “40 queries in the top 20” are reachable in a few months. Revenue targets come later.
- Compare like with like. Use year-over-year comparisons for seasonal businesses, and note migrations, updates and campaigns on the timeline.
- Keep the list short. Three to five KPIs in the monthly report; the rest in an appendix for when something needs explaining.
- Put a value on the target. Our SEO ROI calculator turns a traffic target into conversions, profit and a payback month, using your own conversion rate.
Warning signs in an SEO report
If an agency’s report leads with total backlinks, “domain authority” scores, or a site-wide average position, ask what happened to non-branded clicks and conversions. Those are the numbers you pay for.
If you’d like help setting up the tracking behind these KPIs (Search Console, GA4 key events with consent mode, and a report that shows the trend), that’s part of our data and analytics work.
Frequently asked questions
What are the most important SEO KPIs?
Organic conversions (key events in GA4) and non-branded organic clicks from Search Console. They show whether search brings in new people who take action. The other metrics explain why those two move.
How do you measure SEO success?
Set a baseline before the work starts, then compare the same KPIs month over month and year over year: impressions and indexed pages first, then clicks, then conversions. Judge the trend over several months, not single weeks.
Is average position a good SEO KPI?
Not on its own. Search Console averages position across every query and impression, so ranking for new long-tail queries at position 60 can make the average worse while the site is actually growing.
How often should SEO KPIs be reported?
Monthly for most businesses, with a year-over-year comparison once you have a year of data. Weekly numbers move too much to act on, except when you are watching a migration or a sudden drop.
Related guides
SEO Strategy for Businesses
SEO for Small Businesses: What You Can Do Yourself, and When to Get Help
Most small businesses can handle the basics of SEO themselves: a clear website, a verified Google Business Profile and Search Console. Here's what to do first.
9 min read
SEO Strategy for Businesses
International SEO & Website Localization Statistics 2026
127 statistics on international SEO and website localization, each linked to its original source and checked on 26 October 2026.
29 min read
Link Building and Negative SEO
Our Site Was Hit by a Negative SEO Attack: 1,198 Spam Domains and a 98% Drop in Impressions
In September 2026 our own site went from 498 to 1,321 referring domains, and Google impressions fell from 1,393 to 24. Here is the data and what we did.
6 min read